Pollution
AIR POLLUTION
Video Credits:www.youtube.com
The Karnataka State Pollution Control Board for Prevention and Control of Water Pollution was constituted by the Government of Karnataka on The Twenty First of September Nineteen Seventy Four (21.9.1974) in pursuance of the Water (Prevention & Control of Pollution) Act, 1974 . The Water Act will provide for the prevention and control of water pollution and maintaining or restoring of wholesomeness of water. After the enactment of the Air (Prevention & Control of Pollution) Act, 1981 the enforcing responsibility was entrusted to the above Board. As such, the Board was later renamed as the Karnataka State Pollution Control Board in 1985.The Air (Prevention & Control of Pollution) Act, 1981 is an enactment to provide for prevention, control and abatement of air pollution.
NATIONAL AIR QUALITY MONITORING PROGRAMME
Central Pollution Control Board (CPCB) coordinates the air quality monitoring regime through its nationwide programme known as National Air Quality Monitoring Programme (NAMP). With the assistance of 26 State Pollution Control Boards (SPCBs), 5 Pollution Control Committees (PCCs) along with National Environmental Engineering Research Institute (NEERI) CPCB is monitoring ambient air quality through 363 stations in 139 cities across the country.
The Karnataka State Pollution Control Board (KSPCB) is monitoring ambient air quality under NAMP in 14 monitoring stations at Bangalore and other six major towns in the state. Six of them are in industrial areas, six in residential, rural and other areas and two in sensitive areas. KSPCB has also commissioned two Continuous ambient air quality monitoring stations (CAAQMS), one at City Railway Station and another at Saneguruvanahalli, Bangalore. The stations are operating 24 hours 365 days and the data generated sent to CPCB by e-mail every day.
National Ambient Air Quality Standards effective from November 2009
|
Pollutant
|
Time weighted average
|
Concentration in ambient air
|
|
Notified ecologically sensitive areas
|
All other areas
|
|
Sulphur dioxide (SO2), µg/m3
|
Annual
24 hours
|
20
80
|
50
80
|
|
Nitrogen dioxide (NO2), µg/m3
|
Annual
24 hours
|
30
80
|
40
80
|
|
Particulate matter (PM10), µg/m3
|
Annual
24 hours
|
60
100
|
60
100
|
|
Particulate matter (PM2.5), µg/m3
|
Annual
24 hours
|
40
60
|
40
60
|
|
Ozone (O3), µg/m3
|
8 hours
1 hour
|
100
180
|
100
180
|
|
Lead (Pb) µg/m3
|
Annual
24 hours
|
0.50
1.0
|
0.50
1.0
|
|
Carbon monoxide (CO), µg/m3
|
8 hours
1 hour
|
02
04
|
02
04
|
|
Ammonia (NH3), µg/m3
|
Annual
24 hours
|
100
400
|
100
400
|
|
Benzene (C6H6), µg/m3
|
Annual
|
05
|
05
|
|
Benzo (a) pyrene (BaP) - particulate phase only, ng/m3
|
Annual
|
01
|
01
|
|
Arsenic (As), ng/m3
|
Annual
|
06
|
06
|
|
Nickel (Ni), ng/m3
|
Annual
|
20
|
20
|
Notes: Annual arithmetic mean of minimum 104 measurements in a year at a particular site taken twice a week 24 hourly at uniform intervals. 24 or 8 or 1 hourly values, to be compiled over 98% of the time in a year. 2% of the time they may exceed the limits but not on two consecutive days of monitoring.
NATIONAL AMBIENT AIR QUALITY STANDARDS
National Ambient Air Quality Standards (NAAQS) set limits for air pollutants with an adequate margin of safety to protect public health, vegetation and property. There were seven parameters, namely, sulphur dioxide (SO2), oxides of nitrogen (NOX), ozone (O3), particulate matter (PM), lead (Pb), carbon monoxide (CO) and ammonia (NH3) notified under the Air Act, 1981 and the Environment (Protection) Act, 1986. These are known as air quality criterion pollutants. Under NAMP, CPCB and KSPCB regularly monitor only four viz., sulphur dioxide (SO2), oxides of nitrogen (NOX), suspended particulate matter (SPM) and respirable suspended particulate matter (RSPM) which are less than 10 g in weight, commonly called PM10.
Pollution levels
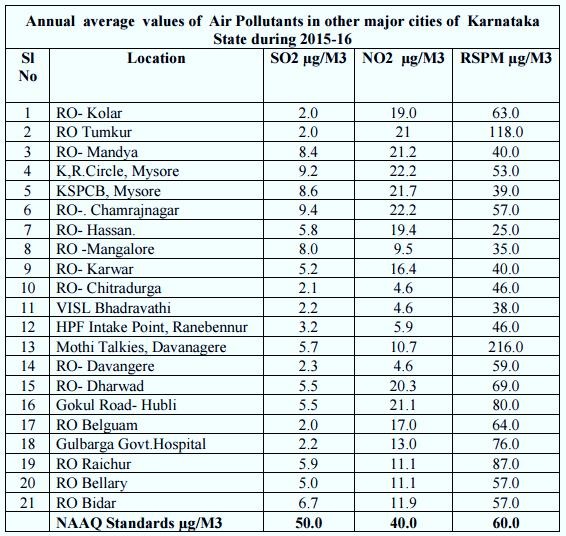
Annual average values of Air Pollutants in other major cities of Karnataka State during 2015-2016

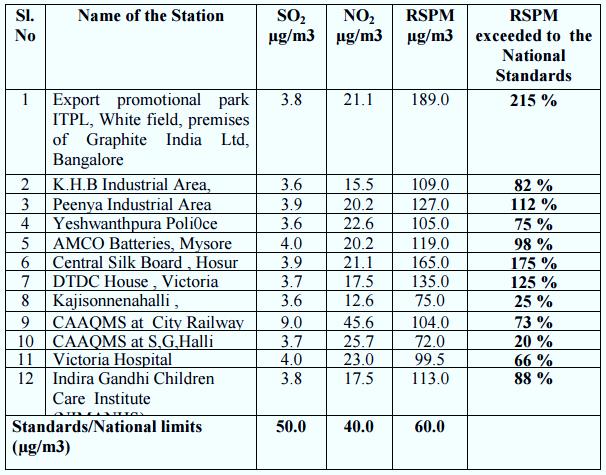
Annual average values of air pollutants at 12 locations in Bangalore City during the year- 2015-16

Source:
SOER Report 2011
Economic Survey Report 2015-16